
For the last two months I was working on Flickerbook, and I did a lot on it! I have rewrote the totals calculator, and then used the same logic on the main page tables and charts. And while doing that also came up with new ideas to display data that I find useful. I added 9new tables and charts for my work data and changed how the last 3 months averages are calculated.
Previously I had two charts that display last 10 weeks net pay and work hours, but now I replaced them with charts that display last 12 weeks data. This way the main page tables and charts are now more organized and can be grouped by the data they display. main groups now are these:
- Weekly data
- YTD data
- Holiday data
- Last 12 weeks / last 3 months data
- Last 12 months/ last year data
As the new tables and charts I have created are mainly for last 12 weeks and last 12 months data I will briefly explain them.
Last 12 Weeks Data
As the name suggests it displays last 12 weeks working hours, earnings or averages. These are helpful when you want to apply for a loan or a mortgage, so I find them handy to have 😉

As I’m getting payed weekly, it is interesting to know how my salary looks like on a monthly basis, that’s why I created a last 3 months monthly averages table and data. As in my country of origin most people get payed monthly, it makes a lot easier to compare my salary to theirs, once I know my monthly earning. These averages are calculated on payments I receive during the month, as I get payed either 5 or 4 times a month, my monthly earnings fluctuate.
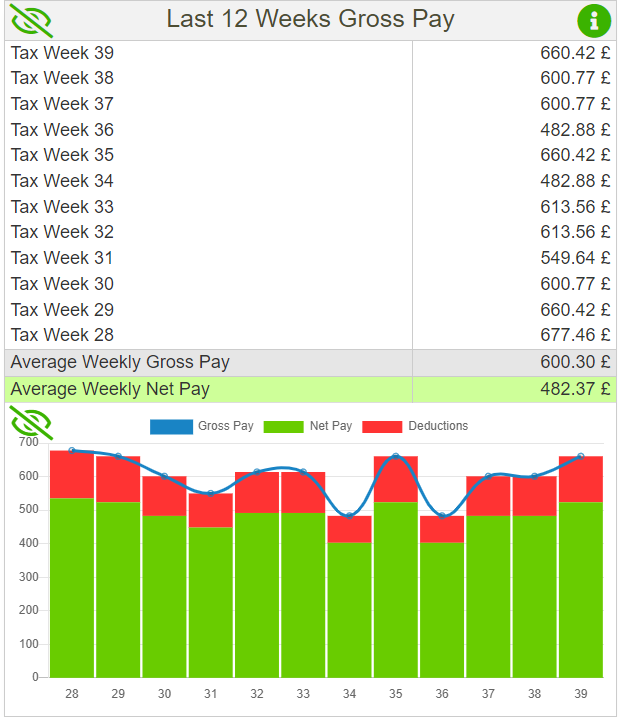
The table below displays similar data to last 3 months averages, (though it is calculated a little bit different and is not identical to last 3 months averages) but in addition it also shows every weeks gross pay. This used to be last 12 weeks net pay chart only, but not only did it now has a table that displays data, but the chart has been enhanced to show both gross pay and net pay with deductions.
Last 12 weeks averages shows similar data to to last 12 weeks gross pay, but this table and chart is similar to payslips YTD section, where it sums up earnings and deductions. This table displays weekly averages.

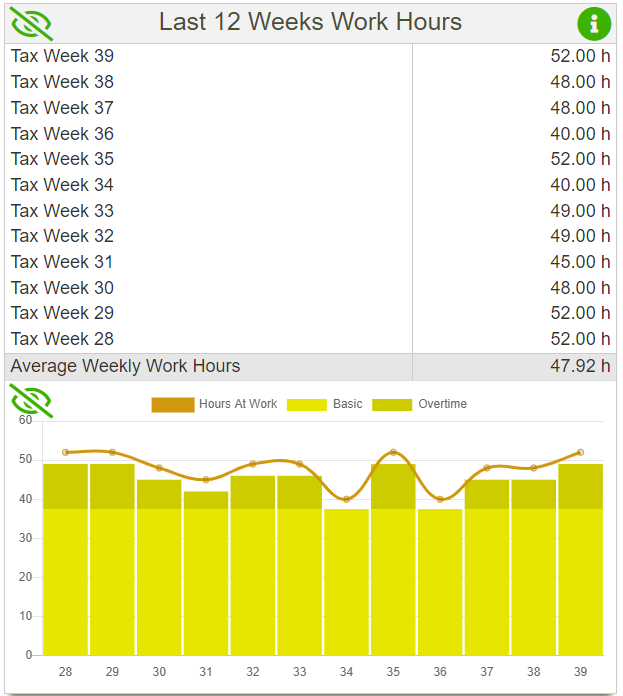
And the last table for last 12 weeks data is working hours. It shows hours spent at work during the week and average hours worked weekly in the last 12 months. The chart earlier only displayed last 10 weeks work related hours, but now it shows last 12 weeks work related hours and hours spent at work.
Last 12 Months Data
Last 12 months data is displayed similarly to last 12 weeks data, just the range of it is bigger. It also only incudes data for months that have already passed. This is done, because I use a pay date in SQL queries, and I don’t want the query to pick data for an incomplete month. Let’s say it today is 23/12/2023 so the query will select data between 01/12/2022 and 01/12/2023.
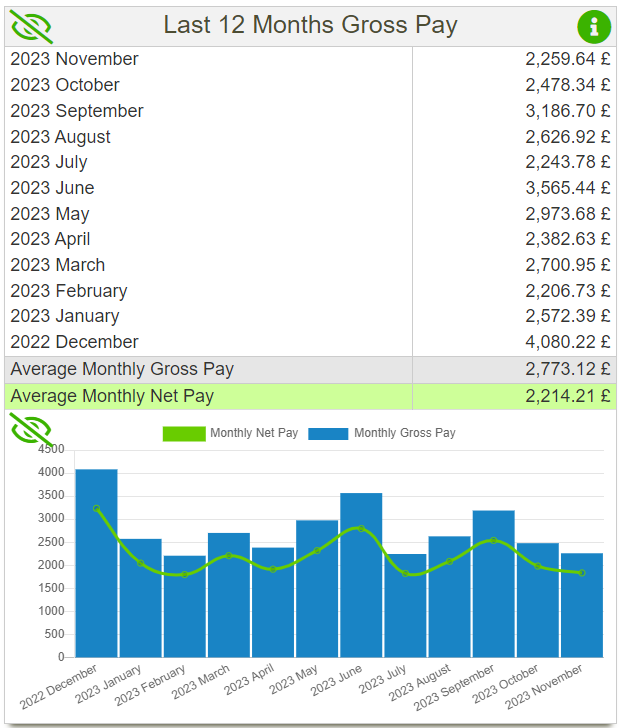
The table below displays my monthly earnings for the last year. I have mentioned earlier that get payed weekly, and this monthly salary data enables me to compare my earnings with those, who get payed monthly.
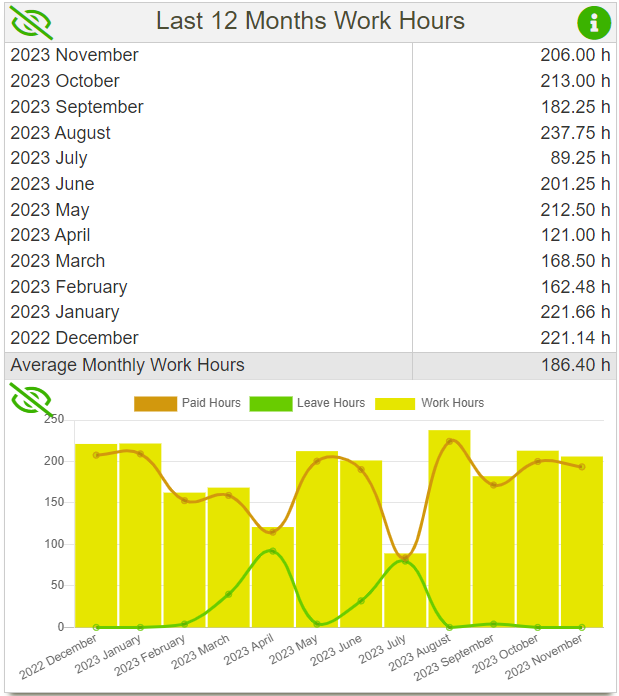
The table below displays hours worked per month. The chart shows work hours (hours spent at work including unpaid breaks), paid hours (hours spent at work that are paid) and leave hours (a sum of all leave hours like holiday, sick paternity).
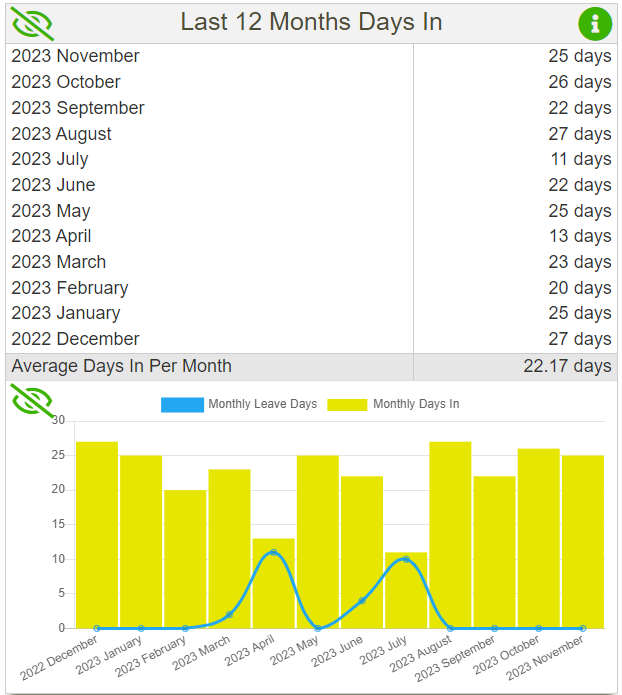
The table below displays days worked per month. Monthly leave days are sum of all leave days including holiday, sick, paternity.
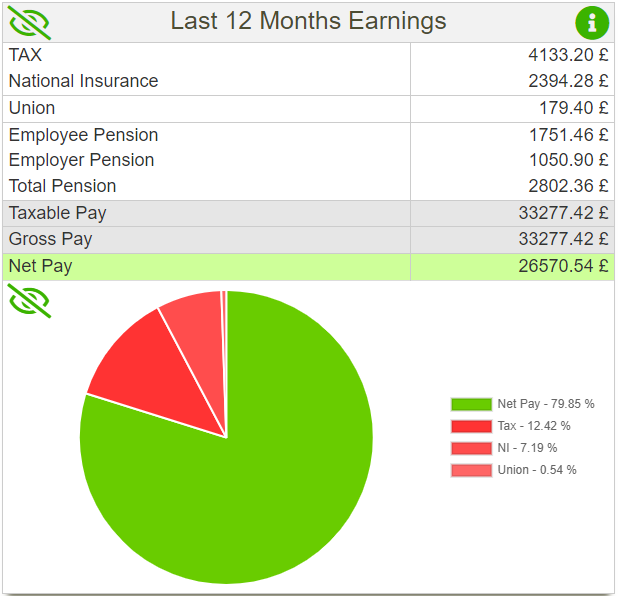
I have also created at table and chart that displays my last year total earnings. This is very similar to a YTD table, and it shows payments received in the last 12 months.
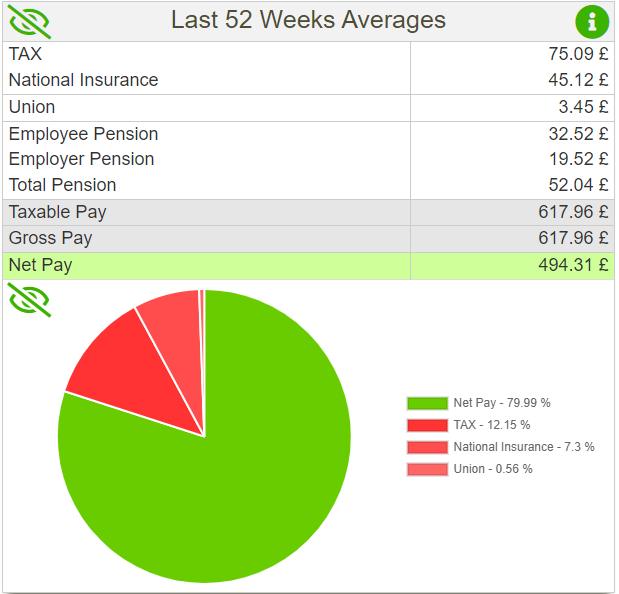
And the last two tables that I have created display last years monthly and weekly averages.

Summary
In order to create these tables and charts a lot of work was done in the background: had to write a lot of queries, add new columns to database tables and fill them with data. And plenty of times this data had to be calculated using existing values in other tables, for example up until now I didn’t have a column for pay date, I only stored a value for a week day that the payment is made (for example 5 meant Friday). Had to write a loop that creates this day and inserts it into database, and in order to do that had to download data from database in an PHP array, which was some new experience.
This is also becoming very time consuming, and I don’t have time to write posts about it, as I want to do as much as possible on Flickerbook. I will now be working on display settings functions, and I still need to rewrite calendar generator, back pay calculator, sort out print view not to mention that I will ideas how to reduce the JavaScript and HTML files, but I just can’t seem to get to that point were I can work on it. As every time I learn something I have to do a lot of rewrites on existing code, though I do feel that I’m becoming better at it and faster as well. Anyways Merry Christmas! 🙂