
I have added 9 new tables and charts to totals calculator, that are listed below:
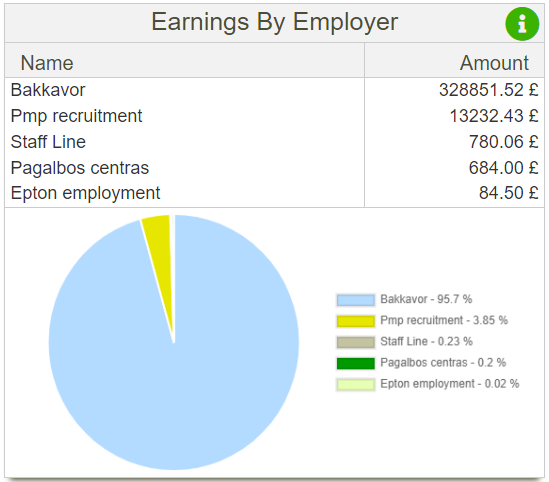
- Earnings By Employer.
- Earnings By Job Title.
- Earnings By Shift.
- Hours Worked By Employer.
- Hours Worked By Job Title.
- Hours Worked By Shift.
- Days Worked By Employer.
- Days Worked By Job Title.
- Days Worked By Shift.
Below is an example of earnings by employer table and pie chart:
HTML
As HTML code for all tables and charts is identical, I will only post earnings by employer table and chart code. Other tables have the same code, just with different element ID’s.
<div class="row">
	<div class="col-md-3 hidden-xs"></div>
		<div class="col-md-6 col-xs-12">
			<div class="col-xs-12 TB"> <!--need this div to render a box shadow border on mobile devices-->
				<div class="table-responsive">
					<table class="table">
						<caption>
							Earnings By Employer
							<i id="payByEmployerInfo" class="fas fa-info-circle" data-toggle="modal" data-target="#infoModal">
						</caption>
						<thead>
							<tr>
								<th class="col-xs-8">Name</th>
								<th class="col-xs-4">Amount</th>
							</tr>
						</thead>
						<tbody id="earningsByEmployerTable">
							<tr>
								<td class="col-xs-8">None</td>
								<td class="col-xs-4">0</td>
							</tr>
						</tbody>
					</table>
				</div>
				<canvas id="earningsByEmployerChart" class="col-xs-12 hidden"></canvas>
			</div>
		</div>
	</div>
</div>
CSS
What I like about this CSS is that earlier I would add a lot of class names to HTML code and now by using CSS selectors I’m able to reduce the amount of classes in HTML file. And this same CSS code get’s applied to all 9 tables.
div .table-responsive {
  margin: 0px;
  margin-top: 20px; }

.TB {
  -webkit-box-shadow: 0 8px 6px -6px #4d4d33;
  box-shadow: 0 8px 6px -6px #4d4d33;
  padding: 0px; }

div div .table {
  border-collapse: collapse;
  margin: 0px; }

div .table-responsive {
  border: none; }

.table tbody {
  border-bottom: 1px solid #cccccc; }

.table tbody tr {
  border-left: 1px solid #cccccc;
  border-right: 1px solid #cccccc; }

div div table caption {
  position: relative;
  padding: 0px 14px; }

table caption i {
  position: absolute;
  right: 4px;
  top: 2px;
  cursor: pointer;
  color: #3bb300;
  font-size: 35px; }

table caption i:hover {
  color: green; }

table caption i:focus {
  color: green; }

table caption i:active {
  color: green; }

.table thead {
  background-color: #f2f2f2;
  color: #4d4d33;
  height: 35px; }

.table thead tr {
  border-left: 1px solid #cccccc;
  border-right: 1px solid #cccccc; }

.table thead tr th:first-child, .table thead tr th:nth-child(2) {
  font-weight: 400;
  font-size: 20px;
  border-bottom: 1px solid #cccccc; }

.table thead tr th:first-child {
  border-right: 1px solid #cccccc;
  text-align: left;
  padding: 0px 0px 0px 15px; }

.table thead tr th:nth-child(2) {
  padding: 0px 15px 0px 0px;
  text-align: right; }

.table tbody tr td {
  border: none !important;
  font-size: 18px;
  padding: 0px; }

.table tbody tr td:first-child {
  text-align: left;
  padding-left: 5px;
  border-right: 1px solid #cccccc !important; }

.table tbody tr td:nth-child(2) {
  padding-right: 5px;
  text-align: right; }

canvas {
  border: 1px solid #cccccc
  border-top: 0px;
  padding: 1%;
  position: relative; }
JavaScript
In the JavaScript code below I only show the code that is responsible for filling the table and sending the data to functions that render a full of empty chart. There are 3 functions in this example. One receives the data from the back end, and then this data gets distributed to a function that creates a table and another function that renders charts.
//charts that are loaded only on totals page
const loadTotasTables = (tableName, response, symbol) => {
	let arrayLength = Object.keys(response).length;
		tableName.innerHTML = "";
	let i=0;
	do {
		let tableRow = document.createElement("tr");
		let tableData = document.createElement("td");
		tableData.setAttribute("class", "col-xs-8");
		tableData.textContent = response[i]['name'];
		tableRow.appendChild(tableData);

		let tableData2 = document.createElement("td");
		tableData2.setAttribute("class", "col-xs-4");
		tableData2.textContent = response[i]['earnings']+" "+symbol;
		tableRow.appendChild(tableData2);
		tableName.appendChild(tableRow);

		i++;
	}
	while (i < arrayLength);
}

//chart names. I need them to assign the chart to and for destroy function to work
let earningsByEmployerChart;
let earningsByJobTitleChart;
let earningsByShiftChart;
let hoursWorkedByEmployerChart;
let hoursWorkedByJobTitleChart;
let hoursWorkedByShiftChart;
let daysWorkedByEmployerChart;
let daysWorkedByJobTitleChart;
let daysWorkedByShiftChart;

//a function that determines if a pie chart needs to be rendered or an empty chart displayed
//helps me avoid duplicate code.
const renderPieChart = (chartElement, chartValues, chartNames, colorArray) => {
	let chart;
	if (Object.keys(chartValues).length > 0 ){
		chart = generateFullChart(chartElement, chartNames, colorArray, chartValues);
	}else {
		chart = generateEmptyChart(chartElement);
	}
	return chart
}

const loadDataTotals = (response) => {
        //earnings
	loadTotasTables(document.getElementById("earningsByEmployerTable"), response.earningsByEmployerArray, "£");
	loadTotasTables(document.getElementById("earningsByJobTitleTable"), response.earningsByJobTitleArray, "£");
	loadTotasTables(document.getElementById("earningsByShiftTable"), response.earningsByShiftArray, "£");
	////hours
	loadTotasTables(document.getElementById("hoursWorkedByEmployerTable"), response.hoursWorkedByEmployerArray, "h");
	loadTotasTables(document.getElementById("hoursWorkedByJobTitleTable"), response.hoursWorkedByJobArray, "h");
	loadTotasTables(document.getElementById("hoursWorkedByShiftTable"), response.hoursWorkedByShiftArray, "h");
	//days
	loadTotasTables(document.getElementById("daysWorkedByEmployerTable"), response.daysWorkedByEmployerArray, "days");
	loadTotasTables(document.getElementById("daysWorkedByJobTitleTable"), response.daysWorkedByJobArray, "days");
	loadTotasTables(document.getElementById("daysWorkedByShiftTable"), response.daysWorkedByShiftArray, "days");

	let totalsPieChartCheckValue = document.getElementById('totalsPieChartCheck').checked;
	if (totalsPieChartCheckValue === true)	{
		loadChartCounterTotals++;
		//remove class hidden from charts
		showTotalsCharts();
		if (loadChartCounterTotals>1) {
			destroyTotalsCharts();
		}

		//call to function that renders pie charts.
		earningsByEmployerChart = renderPieChart(document.getElementById("earningsByEmployerChart"),response.earningsByEmployerChartArrayValues, response.earningsByEmployerChartArrayNames, dayStatisticsColorArray);
		earningsByShiftChart = renderPieChart(document.getElementById("earningsByShiftChart"), response.earningsByShiftChartArrayValues, response.earningsByShiftChartArrayNames, dayStatisticsColorArray);
		earningsByJobTitleChart = renderPieChart(document.getElementById("earningsByJobTitleChart"), response.earningsByJobTitleChartArrayValues, response.earningsByJobTitleChartArrayNames, dayStatisticsColorArray);

		hoursWorkedByEmployerChart = renderPieChart(document.getElementById("hoursWorkedByEmployerChart"), response.hoursWorkedByEmployerChartArrayValues, response.hoursWorkedByEmployerChartArrayNames, dayStatisticsColorArray);
		hoursWorkedByJobTitleChart = renderPieChart(document.getElementById("hoursWorkedByJobTitleChart"), response.hoursWorkedByJobChartArrayValues, response.hoursWorkedByJobChartArrayNames, dayStatisticsColorArray);
		hoursWorkedByShiftChart = renderPieChart(document.getElementById("hoursWorkedByShiftChart"), response.hoursWorkedByShiftChartArrayValues, response.hoursWorkedByShiftChartArrayNames, dayStatisticsColorArray);

		daysWorkedByEmployerChart = renderPieChart(document.getElementById("daysWorkedByEmployerChart"), response.daysWorkedByEmployerChartArrayValues, response.daysWorkedByEmployerChartArrayNames, dayStatisticsColorArray);
		daysWorkedByJobTitleChart = renderPieChart(document.getElementById("daysWorkedByJobTitleChart"), response.daysWorkedByJobChartArrayValues, response.daysWorkedByJobChartArrayNames, dayStatisticsColorArray);
		daysWorkedByShiftChart = renderPieChart(document.getElementById("daysWorkedByShiftChart"), response.daysWorkedByShiftChartArrayValues, response.daysWorkedByShiftChartArrayNames, dayStatisticsColorArray);

	} else {
		hideTotalsCharts();
	}
}
There are a lot more functions necessary for this to work, but I will post just the new ones. However I now think that this script can be made even better. Since a user has the option to select dates to load these tables, theyy can be loaded multiple times. So instead of clearing the table every time, and then adding <tr> elements over again, I’m thinking of a way to improve this function, where instead of deleting all the rows, additional rows are either added or removed, depending on results, and then just filled with proper data. This approach seems a lot more efficient, but will need time to work this out 😉
PHP and SQL
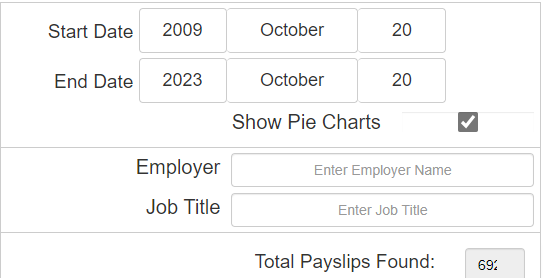
Similar to JavaScript, I will only post the code that is responsible for fetching data from database. On backend I have a script that requires a PHP file with SQL queries depending on the input. As there are 4 possible combinations of input:
- No employer name and no job title.
- Employer name and no job title.
- No employer name with a job title name.
- Both employer name and job title name.
I have 4 PHP scripts to fetch the necessary data.
the example below demonstrates querying database for both employer name and job position name.
if ($totalsPieChartCheck == true) {
	//for ChartJS I need two arrays - one to store names and one to store values.
	$earningsByEmployerChartArrayNames = array();
	$earningsByEmployerChartArrayValues = array();

	$earningsByShiftChartArrayNames = array();
	$earningsByShiftChartArrayValues = array();

	$earningsByJobTitleChartArrayNames = array();
	$earningsByJobTitleChartArrayValues = array();
}
//-----------------------------------------------------------GROSS PAY---------------------//
$querySelectPaymentsSum = "
	SELECT
		SUM(gross_pay) AS earningsByEmployer,
		employer AS employerName
	FROM weekly_payments_amount
	WHERE
		user_id = '$user_id'
		AND taxPeriodNr BETWEEN '$firstTaxPeriodOfYear'	AND '$taxPeriodNumber'
		AND employer = '$employer'
		AND job_title = '$jobTitle'
	GROUP BY
		employer
	ORDER BY
		earningsByEmployer desc";
$resultSelectPaymentsSum = mysqli_query($weeklyPayments, $querySelectPaymentsSum);
$num8 = mysqli_num_rows($resultSelectPaymentsSum);

$earningsByEmployerArray = array();
if ($num8>0){
	while ($row8 = mysqli_fetch_array($resultSelectPaymentsSum, MYSQLI_ASSOC))
	{
		$earningsByEmployerArray[] = array("earnings"=>$row8['earningsByEmployer'], "name"=>$row8['employerName']);
		if ($totalsPieChartCheck == true){
			//prevent deletion from 0
			if ($gross_paySum >0) {
				$earningsByEmployerChartArrayNames[] = $row8['employerName'];
				$earningsByEmployerChartArrayValues[] = ROUND(($row8['earningsByEmployer']/$gross_paySum)*100,2);
			}
		}
	}
} else {
	//send empty values, as the function in javascript that adds data to table needs at least one item in array to work.
	$earningsByEmployerArray[] = array("earnings"=>0, "name"=>"None");
}

//-----------------------------------------------------------GROSS PAY BY SHIFT VALUE---------------------//

$querySelectPaymentsSum = "
	SELECT
		SUM(gross_pay) AS earningsByShift,
		shift_t_val AS shiftType
	FROM weekly_payments_amount
	WHERE
                user_id = '$user_id'
		AND taxPeriodNr BETWEEN '$firstTaxPeriodOfYear'	AND '$taxPeriodNumber'
		AND employer = '$employer'
		AND job_title = '$jobTitle'
	GROUP BY
		shiftType
	ORDER BY
		earningsByShift desc";
$resultSelectPaymentsSum = mysqli_query($weeklyPayments, $querySelectPaymentsSum);
$num8 = mysqli_num_rows($resultSelectPaymentsSum);

$earningsByShiftArray = array();
if ($num8>0){
	while ($row8 = mysqli_fetch_array($resultSelectPaymentsSum, MYSQLI_ASSOC))
	{
		$earningsByShiftArray[] = array("earnings"=>$row8['earningsByShift'], "name"=>$row8['shiftType']);
		if ($totalsPieChartCheck == true){
			if ($gross_paySum >0) {
				$earningsByShiftChartArrayNames[] = $row8['shiftType'];
				$earningsByShiftChartArrayValues[] = ROUND((($row8['earningsByShift']/$gross_paySum)*100),2);
			}
		}
	}
} else {
	//send empty values, as the function in javascript that adds data to table needs at least one item in array to work.
	$earningsByShiftArray[] = array("earnings"=>0, "name"=>"None");
}

/////////////////////////////////////////////////////////GROSS PAY JOB POSITION VALUE////////////////////////////////

$querySelectPaymentsSum = "
	SELECT
		SUM(gross_pay) AS earningsByJobTitle,
		job_title AS jobTitle
	FROM weekly_payments_amount
	WHERE
		user_id = '$user_id'
		AND taxPeriodNr BETWEEN '$firstTaxPeriodOfYear'	AND '$taxPeriodNumber'
		AND employer = '$employer'
		AND job_title = '$jobTitle'
	GROUP BY
		job_title
	ORDER BY
		earningsByJobTitle desc";
$resultSelectPaymentsSum = mysqli_query($weeklyPayments, $querySelectPaymentsSum);
$num8 = mysqli_num_rows($resultSelectPaymentsSum);

$earningsByJobTitleArray = array();
if ($num8>0){
	while ($row8 = mysqli_fetch_array($resultSelectPaymentsSum, MYSQLI_ASSOC))
	{
		$earningsByJobTitleArray[] = array("earnings"=>$row8['earningsByJobTitle'], "name"=>$row8['jobTitle']);
		if ($totalsPieChartCheck == true){
			if ($gross_paySum >0) {
				$earningsByJobTitleChartArrayNames[] = $row8['jobTitle'];
				$earningsByJobTitleChartArrayValues[] = ROUND((($row8['earningsByJobTitle']/$gross_paySum)*100),2);
			}
		}
	}
} else {
	//send empty values, as the function in javascript that adds data to table needs at least one item in array to work.
	$earningsByJobTitleArray[] = array("earnings"=>0, "name"=>"None");
}

$loadIndexesArray += array("earningsByJobTitleArray"=>$earningsByJobTitleArray);
$loadIndexesArray += array("earningsByShiftArray"=>$earningsByShiftArray);
$loadIndexesArray += array("earningsByEmployerArray"=>$earningsByEmployerArray);

if ($totalsPieChartCheck == true){
	$loadIndexesArray += array("earningsByEmployerChartArrayNames"=>$earningsByEmployerChartArrayNames);
	$loadIndexesArray += array("earningsByEmployerChartArrayValues"=>$earningsByEmployerChartArrayValues);

	$loadIndexesArray += array("earningsByShiftChartArrayNames"=>$earningsByShiftChartArrayNames);
	$loadIndexesArray += array("earningsByShiftChartArrayValues"=>$earningsByShiftChartArrayValues);

	$loadIndexesArray += array("earningsByJobTitleChartArrayNames"=>$earningsByJobTitleChartArrayNames);
	$loadIndexesArray += array("earningsByJobTitleChartArrayValues"=>$earningsByJobTitleChartArrayValues);
}
As days and hours data is stored in a separate table, it requires additional PHP scripts to be fetched:
if ($totalsPieChartCheck == true) {
	$hoursWorkedByEmployerChartArrayNames = array();
	$hoursWorkedByEmployerChartArrayValues = array();
	$daysWorkedByEmployerChartArrayNames = array();
	$daysWorkedByEmployerChartArrayValues = array();

	$hoursWorkedByJobChartArrayNames = array();
	$hoursWorkedByJobChartArrayValues = array();
	$daysWorkedByJobChartArrayNames = array();
	$daysWorkedByJobChartArrayValues = array();

	$hoursWorkedByShiftChartArrayNames = array();
	$hoursWorkedByShiftChartArrayValues = array();
	$daysWorkedByShiftChartArrayNames = array();
	$daysWorkedByShiftChartArrayValues = array();
}

//-----------------------------------------------------------HOURS AND DAYS WORKED BY EMPLOYER---------------------//
$querySelectPaymentsSum = "
	SELECT
		SUM(hours_worked) AS hoursWorked,
		COUNT(dayType) AS daysWorked,
		employer AS employerName
	FROM day_indexes
	WHERE
		user_id = '$user_id'
		AND taxPeriodNr BETWEEN '$firstTaxPeriodOfYear'	AND '$taxPeriodNumber'
		AND dayType IN ( '1','4','7')
		AND employer = '$employer'
		AND job_title = '$jobTitle'
	GROUP BY
		employer
	ORDER BY
		daysWorked DESC";
$resultSelectPaymentsSum = mysqli_query($dayIndexes, $querySelectPaymentsSum);
$num8 = mysqli_num_rows($resultSelectPaymentsSum);

$hoursWorkedByEmployerArray = array();
$daysWorkedByEmployerArray = array();

if ($num8>0){
	while ($row8 = mysqli_fetch_array($resultSelectPaymentsSum, MYSQLI_ASSOC))
	{
		$hoursWorkedByEmployerArray[] = array("earnings"=>$row8['hoursWorked'], "name"=>$row8['employerName']);
		$daysWorkedByEmployerArray[] = array("earnings"=>$row8['daysWorked'], "name"=>$row8['employerName']);
		if ($totalsPieChartCheck == true) {
			if ($totalHoursWorked> 0) {
				$hoursWorkedByEmployerChartArrayNames[] = $row8['employerName'];
				$hoursWorkedByEmployerChartArrayValues[] = ROUND((($row8['hoursWorked']/$totalHoursWorked )*100),2);
			}
			if ($daysInForAverages> 0) {
				$daysWorkedByEmployerChartArrayNames[] = $row8['employerName'];
				$daysWorkedByEmployerChartArrayValues[] = ROUND((($row8['daysWorked']/$daysInForAverages)*100),2);
			}
		}
	}
}else {
	$hoursWorkedByEmployerArray[] = array("earnings"=>0, "name"=>"None");
	$daysWorkedByEmployerArray[] = array("earnings"=>0, "name"=>"None");
}

//-----------------------------------------------------------HOURS AND DAYS WORKED BY SHIFT---------------------//
$querySelectPaymentsSum = "
	SELECT
		SUM(hours_worked) AS hoursWorked,
		COUNT(dayType) AS daysWorked,
		shift_t_val AS shiftType
	FROM day_indexes
	WHERE
		user_id = '$user_id'
		AND taxPeriodNr BETWEEN '$firstTaxPeriodOfYear'	AND '$taxPeriodNumber'
		AND dayType IN ( '1','4','7')
		AND employer = '$employer'
		AND job_title = '$jobTitle'
	GROUP BY
		shiftType
	ORDER BY
		daysWorked DESC";
$resultSelectPaymentsSum = mysqli_query($dayIndexes, $querySelectPaymentsSum);
$num8 = mysqli_num_rows($resultSelectPaymentsSum);

$hoursWorkedByShiftArray = array();
$daysWorkedByShiftArray = array();

if ($num8>0){
	while ($row8 = mysqli_fetch_array($resultSelectPaymentsSum, MYSQLI_ASSOC))
	{
		$hoursWorkedByShiftArray[] = array("earnings"=>$row8['hoursWorked'], "name"=>$row8['shiftType']);
		$daysWorkedByShiftArray[] = array("earnings"=>$row8['daysWorked'], "name"=>$row8['shiftType']);
		if ($totalsPieChartCheck == true) {
			if ($totalHoursWorked> 0) {
				$hoursWorkedByShiftChartArrayNames[] = $row8['shiftType'];
				$hoursWorkedByShiftChartArrayValues[] = ROUND((($row8['hoursWorked']/$totalHoursWorked )*100),2);
			}
			if ($daysInForAverages> 0) {
				$daysWorkedByShiftChartArrayNames[] = $row8['shiftType'];
				$daysWorkedByShiftChartArrayValues[] = ROUND((($row8['daysWorked']/$daysInForAverages)*100),2);
			}
		}
	}
}else {
	$hoursWorkedByShiftArray[] = array("earnings"=>0, "name"=>"None");
	$daysWorkedByShiftArray[] = array("earnings"=>0, "name"=>"None");
}

//-----------------------------------------------------------HOURS AND DAYS WORKED BY JOB POSITION---------------------//
$hoursWorkedByJobChartArray = array();
$daysWorkedByJobChartArray = array();

$querySelectPaymentsSum = "
	SELECT
		SUM(hours_worked) AS hoursWorked,
		COUNT(dayType) AS daysWorked,
		job_title AS jobTitle
	FROM day_indexes
	WHERE
		user_id = '$user_id'
		AND taxPeriodNr BETWEEN '$firstTaxPeriodOfYear'	AND '$taxPeriodNumber'
		AND dayType IN ( '1','4','7')
		AND employer = '$employer'
		AND job_title = '$jobTitle'
	GROUP BY
		jobTitle
	ORDER BY
		daysWorked DESC";
$resultSelectPaymentsSum = mysqli_query($dayIndexes, $querySelectPaymentsSum);
$num8 = mysqli_num_rows($resultSelectPaymentsSum);

$hoursWorkedByJobArray = array();
$daysWorkedByJobArray = array();

if ($num8>0){
	while ($row8 = mysqli_fetch_array($resultSelectPaymentsSum, MYSQLI_ASSOC))
	{
		$hoursWorkedByJobArray[] = array("earnings"=>$row8['hoursWorked'], "name"=>$row8['jobTitle']);
		$daysWorkedByJobArray[] = array("earnings"=>$row8['daysWorked'], "name"=>$row8['jobTitle']);
		if ($totalsPieChartCheck == true) {
			if ($totalHoursWorked> 0) {
				$hoursWorkedByJobChartArrayNames[] = $row8['jobTitle'];
				$hoursWorkedByJobChartArrayValues[] =ROUND((($row8['hoursWorked']/$totalHoursWorked )*100),2);
			}
			if ($daysInForAverages> 0) {
				$daysWorkedByJobChartArrayNames[] = $row8['jobTitle'];
				$daysWorkedByJobChartArrayValues[] = ROUND((($row8['daysWorked']/$daysInForAverages)*100),2);
			}
		}
	}
} else {
	$hoursWorkedByJobArray[] = array("earnings"=>0, "name"=>"None");
	$daysWorkedByJobArray[] = array("earnings"=>0, "name"=>"None");
}

$loadIndexesArray += array("hoursWorkedByEmployerArray"=>$hoursWorkedByEmployerArray, "daysWorkedByEmployerArray"=>$daysWorkedByEmployerArray);
$loadIndexesArray += array("hoursWorkedByShiftArray"=>$hoursWorkedByShiftArray, "daysWorkedByShiftArray"=>$daysWorkedByShiftArray);
$loadIndexesArray += array("hoursWorkedByJobArray"=>$hoursWorkedByJobArray, "daysWorkedByJobArray"=>$daysWorkedByJobArray);

if ($totalsPieChartCheck == true) {

	$loadIndexesArray += array("hoursWorkedByEmployerChartArrayNames"=>$hoursWorkedByEmployerChartArrayNames);
	$loadIndexesArray += array("hoursWorkedByEmployerChartArrayValues"=>$hoursWorkedByEmployerChartArrayValues);
	$loadIndexesArray += array("daysWorkedByEmployerChartArrayNames"=>$daysWorkedByEmployerChartArrayNames);
	$loadIndexesArray += array("daysWorkedByEmployerChartArrayValues"=>$daysWorkedByEmployerChartArrayValues);
	$loadIndexesArray += array("hoursWorkedByJobChartArrayNames"=>$hoursWorkedByJobChartArrayNames);
	$loadIndexesArray += array("hoursWorkedByJobChartArrayValues"=>$hoursWorkedByJobChartArrayValues);
	$loadIndexesArray += array("daysWorkedByJobChartArrayNames"=>$daysWorkedByJobChartArrayNames);
	$loadIndexesArray += array("daysWorkedByJobChartArrayValues"=>$daysWorkedByJobChartArrayValues);
	$loadIndexesArray += array("hoursWorkedByShiftChartArrayNames"=>$hoursWorkedByShiftChartArrayNames);
	$loadIndexesArray += array("hoursWorkedByShiftChartArrayValues"=>$hoursWorkedByShiftChartArrayValues);
	$loadIndexesArray += array("daysWorkedByShiftChartArrayNames"=>$daysWorkedByShiftChartArrayNames);
	$loadIndexesArray += array("daysWorkedByShiftChartArrayValues"=>$daysWorkedByShiftChartArrayValues);
}
I still think the JavaScript code can be improved. Also I now would like to replace all of the table elements in Flickerbook that are created using <div> with proper <table> elements, but this will be a very large job to do, as I will have to rearrange how the data is being sent to front end (store data that is meant for tables in separate arrays), also will have to rewrite functions that are responsible for table animations, that animate table height and fades out/ fades in text. And there are a lot more work that I can do, as after refreshing and working on other projects I can see how I can make Flickerbook better: that is I can achieve same results with a lot less code. Will try to work on it, but this will mean theta at least for couple of months I will not be studying anything data analytics related 🙁