
Had some time to sit down and improve shortage report and Flickerbooks YOY charts.
Work Done on Shortage Report
All the goals set in the post here were achieved, apart from the last one: the function that splits pasted shortage text was not rewritten as I will continue to use the old version of order processor.
I’m now able to add order/location name to the shortage report table.
HTML and CSS code
In order to place html elements in the order demonstrated in the picture below:

I wrote this HTML code:
		<section class="noDisplay grid-item grid-item-combineTables" id="grid14">
			<input type="checkbox" id="combineTables" name="combineTables">
			<label for="combineTables" class="marginRight"> Combine Shortages</label>
			<label for="orderName">Select name</label>
			<select name="orderName" id="orderName" class="marginRight2">
			  <option value="Wave 1">Wave 1</option>
			  <option value="Wave 2">Wave 2</option>
			  <option value="Wave 3">Wave 3</option>
			  <option value="Veg Prep">Veg Prep</option>
			  <option value="Cook House">Cook House</option>
			  <option value="Box Shed">Box Shed</option>
			  <option value="Customed">Customed</option>
			</select>
			<label for="customName">Custom name:</label>
			<input type="text" id="customName" name="customName" disabled placeholder="Select custom" maxlength="30" class="marginRight2">
			<button type="button" id="addNameButton" class="greenButton" title="Insert order name to shortage report table">Insert Name</button>
		</section>
and CSS code:
#addNameButton, select, #customName, #combineTables {
	padding: 10px;
	font-size: 20px;
}
.grid-item-combineTables{
	grid-column: 1 / 13;
	border-top: 1px solid grey;
}
#grid14 {
	padding: 20px 0px 20px 0px;
}
.marginRight{
	margin-right: 50px;
}
.marginRight2{
	margin-right: 10px;
}
and the result on web app looks like this:

JavaScript code
To make this new feature work I wrote to JavaScript functions. One function takes the name value from either drop down menu or input field and inserts a single table row to shortage report table that spans for 6 columns. The other function changes the text input’s field disabled status to either true or false: if in the dropdown menu the name is selected as “Customed” the input field disabled state is changed to false and a user can enter text. The code for these functions is demonstrated below.
//I need this variable to determine if there has been any values added to table.
//I use it to clear the empty row if a location/order name need to be added as the first table row to the table
let isTableEmpty = true;
const addNameToShortageTable = () => {

	//first select value from the dropdown menu
	let nameValue = document.getElementById("orderName").value;

	//if custom name is selected, then use the name value from text input field.
	if (nameValue === "Customed") {
		nameValue = document.getElementById("customName").value;

		//if empty string report error
		let textInput = document.getElementById("customName");
		if (nameValue === "") {
			//add alert message
			alert("Please provide a name for order/location!");
			//add error border;
			textInput.setAttribute("class", "errorBorder");
		} else {
			//remove error border
			textInput.removeAttribute("class", "errorBorder");
		}
	}

	//to prevent inserting empty row, name will be added to table only if it has a value
	if (nameValue !== "") {
		let shortageTable = document.getElementById("shortageTable");
		//if the name is the first table row in the table, I must remove the empty tablew row first;
		let combine = document.getElementById("combineTables").checked;
		if (isTableEmpty === true || combine === false ){
			shortageTable.innerHTML = "";
		}

		//create an empty table row
		let tableRow = document.createElement("tr");

		//then create empty td element with empty space
		let tableData1 = document.createElement("td");
		tableData1.setAttribute("colspan", "6");
		tableData1.innerHTML = nameValue;
		tableRow.appendChild(tableData1);

		//then instert empty table row back into table.
		shortageTable.appendChild(tableRow);
		isTableEmpty = false;
	}
}
const enableInput = () => {
	let value = document.getElementById("orderName").value;
	let textInput = document.getElementById("customName");
	if (value === "Customed") {
		//remove disabled attribute
		textInput.disabled = false;
	} else {
		//add disabled attribue
		textInput.disabled = true;
	}
}

 const init2 = ()=> {

        //OTHER CODE CONTAINED IN THIS FUNCTIO IS DELETED FOR THIS EXAMPLE
        //THESE FUNCTIONS GET LOADED AFTER DOM

	let addNameButton = document.getElementById("addNameButton");
	addNameButton.onclick = addNameToShortageTable;

	let orderName = document.getElementById("orderName");
	orderName.addEventListener("change", enableInput);
}
I have also declared a isTableEmpty variable. Once I allow to combine shortages, I need to know if the table is empty before adding new table rows. For styling purposes I keep one row with empty data cells once the page get’s loaded, and I need to determine if this row needs to be deleted or not, and that is what this new variable does. It was used in a few more locations in the JavaScript file where its value is amended to either true of false.
Work Done on Flickerbook
On Flickerbook web app I previously had two bar charts where one showed daily gross pay and another showed daily gross pay for day in. I know changes these two charts and one shows daily gross pay and the other displays hourly gross pay. The daily gross pay chart is a line chart that displays two lines:
- Daily gross pay.
- Daily gross pay for day in.
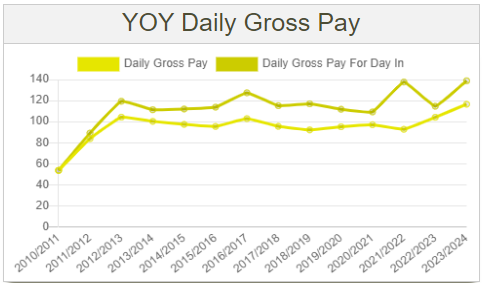
As the name suggests, the daily gross pay line shows a value that is calculated by dividing gross pay sum for tax year by all work related days (days in, holidays, sick days and so on), while daily gross pay is calculated by dividing gross pay by only days in sum (in this case, half day in is counted as a day in).
The other chart shows 3 lines for hourly gross pay:
- Average hourly gross pay for paid hours.
- Average hourly gross pay for hours spent at work.
- Average hourly gross pay for all work related hours.
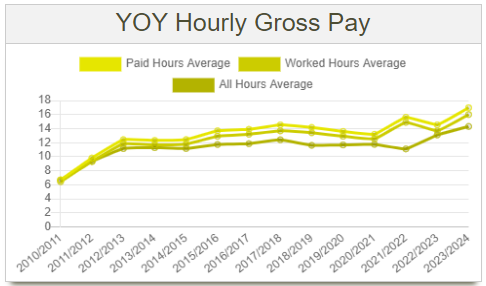
Average hourly gross pay for paid hours is calculated by dividing gross pay sum for tax year by sum of paid hours spent at work (it means that only work hours are included in this sum and annual leave or other leave hours are excluded).
Average hourly gross pay for hours spent at work is calculated by dividing gross pay sum for tax year, by the sum of hours spent at work (it means that all hours spend at work are included, even the unpaid breaks). If all breaks are paid this average value would be identical to Average hourly gross pay for paid hours.
Average hourly gross pay for all work related hours is calculated by dividing gross pay sum for tax year by the sum of all work related hours (annual, sick, family leave hours and so on are included in this sum). This will always be the lowest average value of all three.
I was always curious about how much my 1 hour or 1 day spent at work is worth money wise. When I divide all my earnings by either hours or days spent at work I get the answer. These charts show how these values change over the years and how much my day in or hour spent at work is actually costing the company.
Updated code can be found on this GitHub repository.