
Since neither chart 2 nor chart 3 are dynamic, coding them was a lot easier. All I had to do is just pass data from back end and format the charts. I Decided to place both charts in one row on the website. To do so added this html code:
			<section>
				<div id="chart2Container"></div>
				<div id="chart3Container"></div>
			</section>
Then included this in the CSS file, where chart 2 will take up 34% of the row (as it is only two columns) and chart 3 will take 64% of the row’s width (as it is 8 columns)
#chart2Container, #chart3Container{
	height: 400px;
	display: inline-block;
        background-color: white;
}
#chart2Container {
        width: 34%;
}
#chart3Container{
	width: 64%;
}
Rendering chart 2
To render chart 2 I wrote a function renderChart2(), which gets called after successful AJAX call.
renderChart2(response.palletsIN, response.palletsOUT, startAndEndDate);Formatted and finished code for this function is demonstrated below.
const renderChart2 = (palletsIN, palletsOUT, startAndEndDate = " ") => {
	CanvasJS.addColorSet("greenRed", ["green", "red"]);
	let chart = new CanvasJS.Chart("chart2Container", {
		animationEnabled: true,
		exportEnabled: true,
		colorSet: "greenRed",
		theme: "light1",
		title:{
			fontSize: 20,
		},
		axisY: {
			title: "Pallet Quantity",
			labelFontSize: 14,
			titleFontSize: 20,
			includeZero: true,
		},
		data: [{
			type: "column",
			indexLabelFontSize: 14,
			indexLabel: "{y}",
			dataPoints: [
				{ y: palletsIN, label: "Pallets IN" },
				{ y: palletsOUT,  label: "Pallets OUT" }
			]
		}]
	});
	chart.render();
	chart.title.set("text", "Pallets In and OUT "+startAndEndDate);
 }
And that is it! As this chart only renders two columns, it is the easiest chart of them all.
Rendering chart 3
To render chart 3 I wrote a function renderChart3(), which gets called after successful AJAX call.
renderChart3(response.transferTypseSumsArray, startAndEndDate);Formatted and finished code for this function is demonstrated below.
const multipleGreenRed = ["green", "red", "green","red", "red", "green","red", "green"];
const renderChart3 = (transferTypseSumsArray, startAndEndDate = " ") => {
	CanvasJS.addColorSet("multipleGreenRed", multipleGreenRed);
	let chart = new CanvasJS.Chart("chart3Container", {
		animationEnabled: true,
		exportEnabled: true,
		colorSet: "multipleGreenRed",
		theme: "light1",
		title:{
			fontSize: 20,
		},
		axisY: {
			title: "Pallet Quantity",
			labelFontSize: 14,
			titleFontSize: 20,
			includeZero: true,
		},
		data: [{
			type: "column",
			indexLabelFontSize: 14,
			indexLabel: "{y}",
			dataPoints: [
				{ y: transferTypseSumsArray["Admin IN"], label: "Admin IN" },
				{ y: transferTypseSumsArray["Admin OUT"], label: "Admin OUT"},
				{ y: transferTypseSumsArray["Correction IN"], label: "Correction IN" },
				{ y: transferTypseSumsArray["Returns"], label: "Returns" },
				{ y: transferTypseSumsArray["Reversed Transfer IN"], label: "Reversed Transfer IN" },
				{ y: transferTypseSumsArray["Transfer IN"], label: "Transfer IN" },
				{ y: transferTypseSumsArray["Transfer OUT"], label: "Transfer OUT" },
				{ y: transferTypseSumsArray["Unknown"], label: "Unknown" },
			]
		}]
	});
	chart.render();
	chart.title.set("text", "Transfers by type "+startAndEndDate);
 }
After uploading half a year worth of transfers, I get these results:
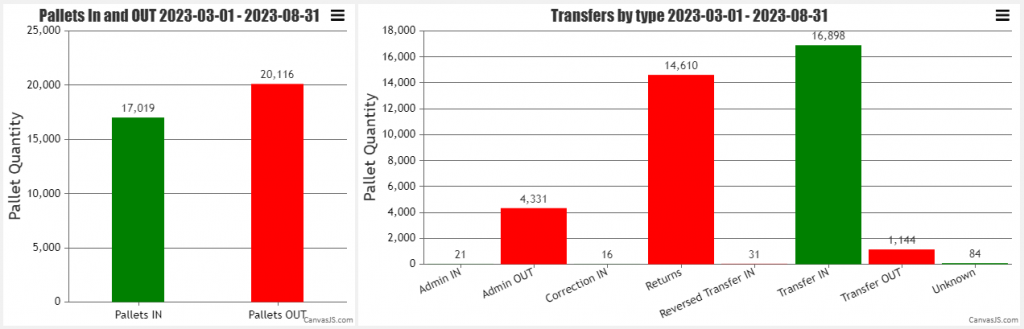
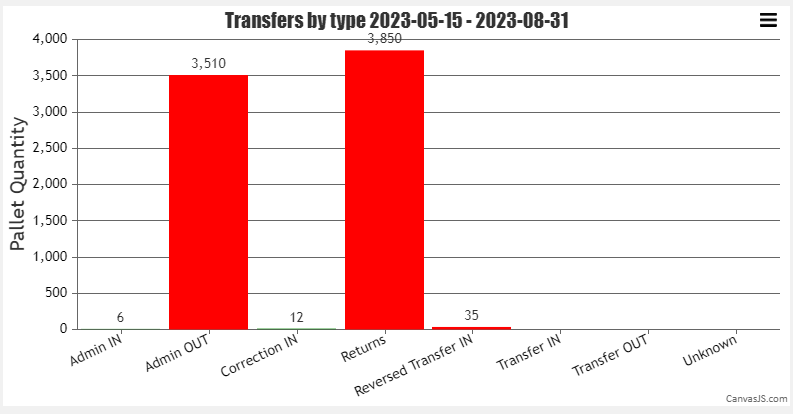
These are the results I expect, however not everything is working properly, as if I upload one month worth of transfers, chart 3 is not correct. I’ll fix this later, now it’s time to render empty charts.
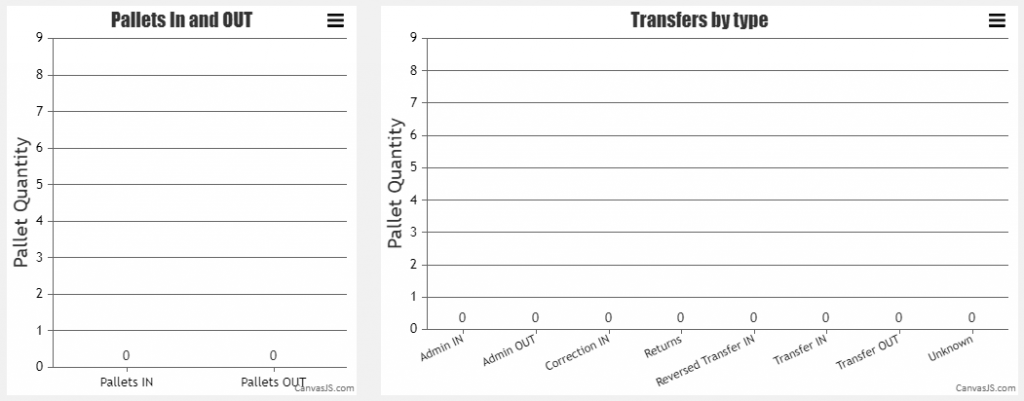
Rendering empty charts
In order to render empty charts, in the start() function I just added calls to renderChart2() and renderChart3() functions and passed 0 or empty values to them.
    renderChart2(0, 0);
    let transferTypseSumsEmptyValuesObject = {
	"Admin IN": 0,
	"Admin OUT": 0,
	"Correction IN": 0,
	"Returns": 0,
	"Reversed Transfer IN": 0,
	"Transfer IN": 0,
	"Transfer OUT": 0,
	"Unknown": 0
     }
    renderChart3(transferTypseSumsEmptyValuesObject);
Chart 2 has labels declared inside renderChart2() function, however chart 3 does not. That’s why an object transferTypseSumsEmptyValuesObject was declared, with labels added to every transfer type, and then this object gets passed to renderChart3() function to render empty chart with transfer type names.
Fixing back end bugs
Now it’s time to fix the bug I mentioned earlier. If the uploaded transfers file does not contain all transfer types, this code just fills transferTypseSumsArray with sum values in the order they were picked up from database, without assigning a transfer type as a key value to it. So if there are 4 transfer types in the file, this array will have first 4 values filled, and the last 4 values missing from the array, which is incorrect.
After going through PHP code at back end, I found the cause of this. It is marked in red in the code below.
$transferTypesNamesArray = array("Admin IN","Admin OUT","Correction IN","Returns","Reversed Transfer IN","Transfer IN","Transfer OUT", "Unknown");
$transferTypseSumsArray = array();
for ($i = 0; $i <Count($transferTypesNamesArray); $i++){
	$transferTypseSumsArray[$transferTypesNamesArray[$i]]= 0;
}
$palletsIN = 0;
$palletsOUT = 0;
$querySelectPalletSum = "
	SELECT
		transactionType,
		SUM(quantity) AS palletSum
	FROM ChepReport
		WHERE 1

	GROUP BY
		transactionType
	ORDER BY
		transactionType
	";
$resultPalletSum= mysqli_query($shortageReportDB, $querySelectPalletSum);
$num = mysqli_num_rows($resultPalletSum);
$arrayIndex = 0;
if ($num>0){
	while ($row = mysqli_fetch_array($resultPalletSum, MYSQLI_ASSOC))
	{
		$palletSum = ROUND($row['palletSum'],0);
		//add pallet sum from row to either $palletsIN or PalletsOUT variable
		if($palletSum > 0) {
			$palletsIN+=$palletSum;
		} else {
			$palletsOUT += $palletSum;
		}
		//for chart I don't want negative values
		$palletSum = abs($palletSum );
		$transferTypseSumsArray += array($transferTypesNamesArray[$arrayIndex]=>$palletSum);
                $transferTypseSumsArray[$transactionType]=$palletSum;
		$arrayIndex++;
	}
} else {
	ReportErrorForEmptyExcelFile();
}
I sorted this bug, by first filling the transferTypseSumsArray with 0 values inside a for loop, and then updating the values for it inside while loop (changes are marked in red and green colours in the code example above).
Charts 2 and 3 are now done, time to do the last chart! 🙂
Github.com repository has been updated.