
Before I can declare first chart finished, there are a couple more that need tidying up. In this post I go through the last work done on chart 1, which is:
- changing chart’s height dynamically.
- rendering an empty chart if no data is provided.
- adding start and end dates to charts title.
Changing charts height dynamically
Since this first chart is dynamic, it means that it height will fluctuate depending on the data provided. What I do not want is the chart to be cramped. If I don’t adjust to it I more likely then not will end up with a result like this:
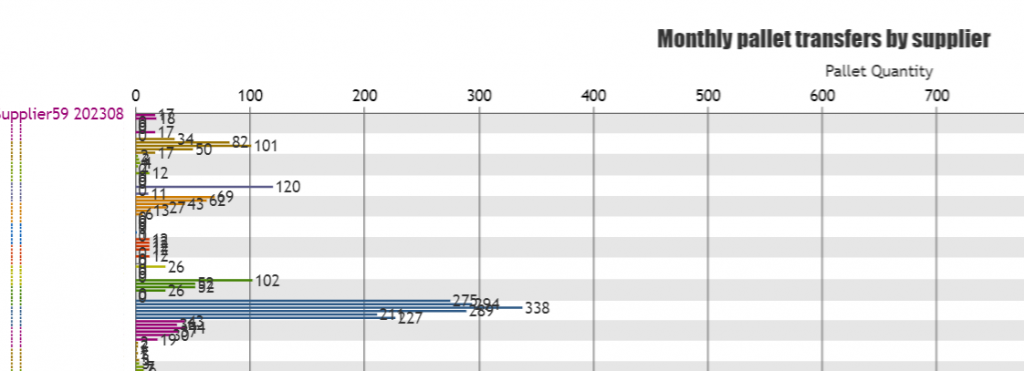
Now this is not a useful chart is it? In order to avoid this, I nested the chart container in HTML file inside a section tag like this:
			<section class="chart" id="chart1OuterContainer">
				<div id="chart1InnerContainer"></div>
			</section>
Then in CSS file I set heights for both <section> and <div> tags and will make the <section> tag scrollable:
#chart1InnerContainer {
	height: 980px;
	width: 98%;
}
#chart1OuterContainer {
	height: 1000px;
	width:100%;
	overflow: scroll;
}
After this, all I wrote little JavaScript code that changes the height of the <div> tag depending on results. The code for it look like this:
		let chart1InnerContainerHeight = monthCount*supplierCount*20;
		if (chart1InnerContainerHeight> 980) {
			chart1InnerContainerHeight +="px";
			document.getElementById("chart1InnerContainer").style.height = chart1InnerContainerHeight;
		}
This code first calculates the desired height of the chart by multiplying monthCount*supplierCount*20 where 20 stands for 20px for each bar chart. Then if the desired height is bigger then the height set in CSS file, it updates the <div> elements height that contains chart to desired height. This code is placed inside organizeDataForChart1() function right before the line that calls renderChart1() function.
		let chart1InnerContainerHeight = monthCount*supplierCount*20;
		if (chart1InnerContainerHeight> 980) {
			chart1InnerContainerHeight +="px";
			document.getElementById("chart1InnerContainer").style.height = chart1InnerContainerHeight;
		}
                //call the function to render the chart
	        renderChart1(colorArrayForChart1, stripLinesArray, dataPointsArray);
And this way one problem of rendering a cramped chart is solved 🙂
Rendering an empty chart
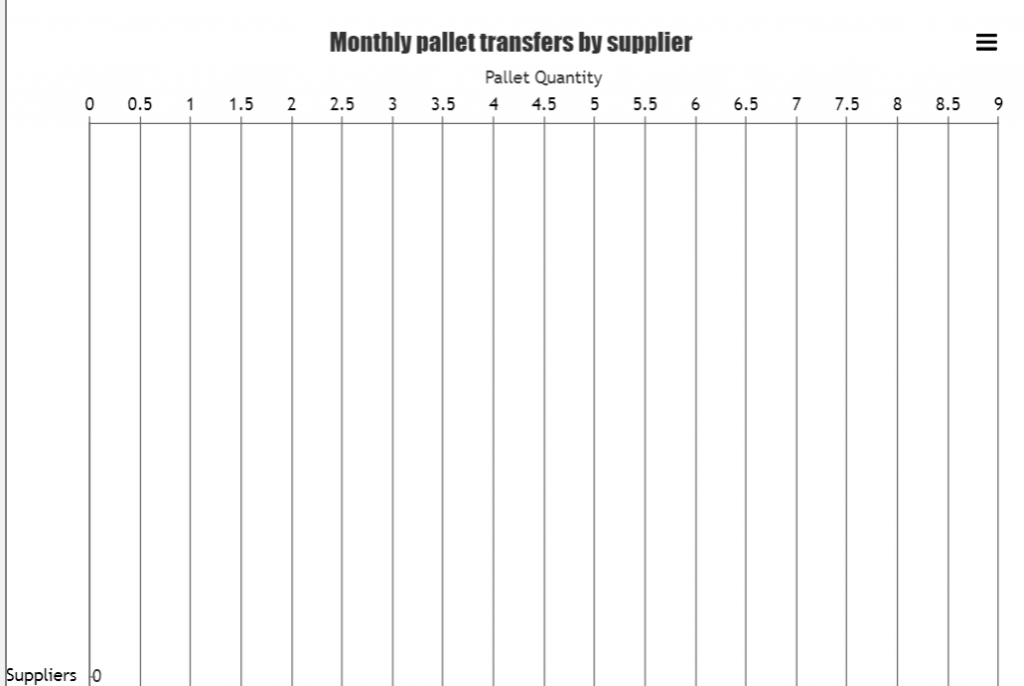
One more thing I want to do is to draw an empty chart on page load, or if an excel file was uploaded with empty rows. I do it by simply calling renderChart1() function and sending empty values to it like this:
renderChart1(colorArray, [{value: 0, label: "Suppliers", labelPlacement: "outside", labelBackgroundColor: "white", color: "transparent", labelFontColor: "black"}],[{label:"supplier", y:0}]);This code is placed in two places: in the start() function that gets activated when the DOM content is loaded and inside the organizeDataForChart1() function if the condition (supplierCount > 0) returns false. The result of this empty chart looks like this:
Adding start and end dates to charts title
To be honest I should have done this when formatting the chart, but it only now hit me, that I can add the dates of the time period that the transfers occurred. So I added it to the title, as I believe this little piece of information is handy.
The first thing I did I declared a variable startAndEndDate which is placed right before the organizeDataForChart1() function inside AJAX call function. startAndEndDate concatenate start and end dates into one string, that gets passed to organizeDataForChart1() function.
					let startAndEndDate = response.startDate+" - "+response.endDate;
					organizeDataForChart1(response.resultArray, response.distinctSuppliersNamesArray, response.distinctMonths, startAndEndDate);
Inside the organizeDataForChart1() function nothing is done with this variable: it just gets passed to the renderChart1() function to be added to the title later. A simplified code version for passing startAndEndDate variable is demonstrated below.
const organizeDataForChart1 = (chartData, distinctSuppliersNamesArray, distinctMonths, startAndEndDate) => {
       //count object keys to determine the length of the object
       let supplierCount = Object.keys(distinctSuppliersNamesArray).length;
       let monthCount = Object.keys(distinctMonths).length;

       //else a no data for chart will be displayed.
       if (supplierCount > 0) {

              //CODE DISCUSSED IN PREVIUOS POSTS TO ARRANGE DATA AND COLORS

              //call the function to render the chart
	      renderChart1(colorArrayForChart1, stripLinesArray, dataPointsArray, startAndEndDate);

	 } else {
		 //draw empty chart
		renderChart1(colorArray, [{value: 0, label: "Suppliers", labelPlacement: "outside", labelBackgroundColor: "white", color: "transparent", labelFontColor: "black"}],[{label:"supplier", y:0}]);

	 }
}
I had to do some changes to the renderChart1() function too. First I added one more parameter for this function: startAndEndDate = ” “ and set default value to an empty string to avoid “undefined” word inside the title. Second I removed the original declaration of title, as in order to render title dynamically I will be using titles set method like this:
chart.title.set("text", "Monthly pallet transfers by supplier "+startAndEndDate);This method will set new title every time the chart is rendered. The updated renderChart1() function code is demonstrated below.
const renderChart1 = (colorArrayForChart1, stripLinesArray, dataPointsArray, startAndEndDate = " ") => {

	CanvasJS.addColorSet("customColorSet1", colorArrayForChart1);

	 let chart = new CanvasJS.Chart("chart1InnerContainer", {
	  theme: "light1",
	  animationEnabled: true,
	  exportEnabled: true,
	  colorSet: "customColorSet1",
	  title: {
		text: "Monthly pallet transfers by supplier "+startAndEndDate,
		fontSize: 20,
	  },
	  axisX: {
		titleFontSize: 20,
		labelFontSize: 14,
		tickPlacement: "inside",
		stripLines: stripLinesArray,
		//removes all labels from axes, later on they are added but as stripLines and with colors.
		labelFormatter: function(e) { 	return "";}
	  },
	  axisY2: {
		title: "Pallet Quantity",
		titleFontSize: 14,
		labelFontSize: 14,
		includeZero: true,
	  },
	  data: [{
		type: "bar",
		indexLabelFontSize: 14,
		axisYType: "secondary",
		indexLabel: "{y}",
		dataPoints: dataPointsArray
	  }]
	});
	chart.render();
	chart.title.set("text", "Monthly pallet transfers by supplier "+startAndEndDate);
}
And now once the chart is rendered it looks like this:
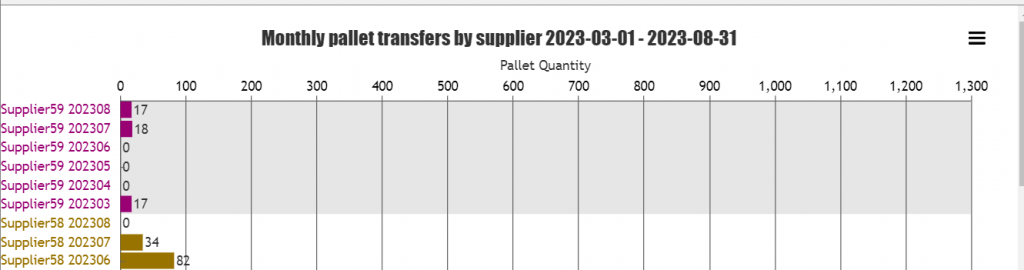
Adding dates to the chart makes it easier to spot if the data for the start and end months are complete, for example if the end or start date is 15th of the month, that means that for these months at least two weeks of transfers data is missing, so the bar charts are inaccurate.
Finishing touch
And there is one more little thing I’ve done. I want to allow only excel files to be uploaded so added this
<input id="uploadButton" type=file name="files[]" accept="application/vnd.openxmlformats-officedocument.spreadsheetml.sheet" />I should have done this a lot earlier, but better later then never 😉 and whohoo, chart 1 is done!
Github.com repository has been updated.