
Had some spare time last week so I started coding the first chart. And the results are satisfying, though there were some issues, but managed to get around them 😉
For this project I decided to use https://canvasjs.com/ chart library, as I haven’t used it for several years, so this will be a good opportunity to refresh my skills 😉
First Steps for chart 1
First thing to do was to include CanvasJS Chart CDN link to index.html <head></head> section in order for the library to work.
<script src="https://cdn.canvasjs.com/ga/canvasjs.min.js"></script>then I set up functions in JavaScript file that will pass data retrieved from back end to draw the chart. The logic of these functions is demonstrated in the code below:
const renderChart1 = (colorArrayForChart1, stripLinesArray, dataPointsArray) => {
     //code to render chart
}
const organizeDataForChart1 = (chartData, distinctSuppliersNamesArray, distinctMonths) => {
     //code to prepare data for the chart to be rendered

     //once data is ready send it to this funcion to render the chart
     renderChart1(colorArrayForChart1, stripLinesArray, dataPointsArray);
}

//1st this function gets called on successful AJAX call to back end
organizeDataForChart1(response.resultArray, response.distinctSuppliersNamesArray, response.distinctMonths);
As this chart is dynamic (the number of months, suppliers and quantities vary), I will have to use loops to create arrays to store data that later will be passed to the chart rendering function, so to make the code look more readable I separated the creation of array’s that store data for chart into a separate function called organizeDataForChart1(). This function gets called after a successful AJAX call. Once the data is prepared for the chart inside organizeDataForChart1() function it then gets passed to renderChart1() function, which rendersthe chart on the website.
After establishing these functions I added a sample JavaScript code from https://canvasjs.com/ website. The code that renders the sample chart is demonstrated below.
var chart = new CanvasJS.Chart("chartContainer", {
  theme: "dark2", // "light1", "light2", "dark1"
  animationEnabled: true,
  exportEnabled: true,
  title: {
    text: "Top 10 Most Viewed YouTube Videos"
  },
  axisX: {
    margin: 10,
    labelPlacement: "inside",
    tickPlacement: "inside"
  },
  axisY2: {
    title: "Views (in billion)",
    titleFontSize: 14,
    includeZero: true,
    suffix: "bn"
  },
  data: [{
    type: "bar",
    axisYType: "secondary",
    yValueFormatString: "#,###.##bn",
    indexLabel: "{y}",
    dataPoints: [
      { label: "Learning Colors", y: 4.91 },
      { label: "Uptown Funk", y: 4.96 },
      { label: "Wheels on the Bus", y: 5.36 },
      { label: "Phonics Song with Two Words", y: 5.36 },
      { label: "See You Again", y: 5.94 },
      { label: "Shape of You", y: 6.02 },
      { label: "Bath Song", y: 6.26 },
      { label: "Johny Johny Yes Papa", y: 6.73 },
      { label: "Despacito", y: 8.20 },
      { label: "Baby Shark Dance", y: 13.01 }
    ]
  }]
});
chart.render();
}
I used this code as a base to fill it with data. Will explain how it was done step by step. The sample chart from https://canvasjs.com/ is demonstrated in the image below.
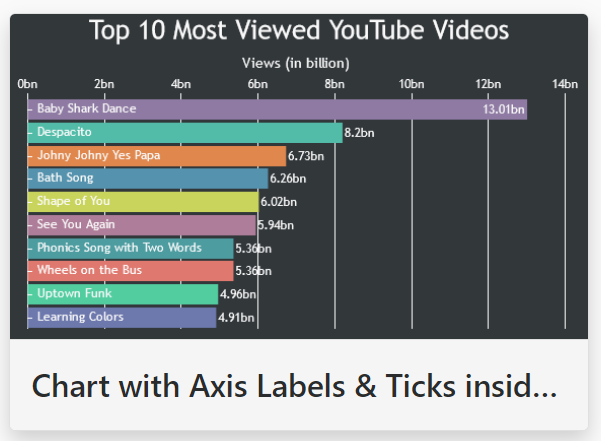
Now once I have a sample chart, I will start working from it as a basis. In my next post I will show formatting changes done to this chart.