
So after I uploaded the data extracted from the excel file to my database worth of half a year of pallets transactions, I ran an SQL query that selects quantity of pallets delivered by each supplier by month.
        SELECT
		otherParty,
		SUM(quantity) AS monthlySum,
		yearMonthDate
	FROM ChepReport
		WHERE transactionType = 'Transfer In'
	GROUP BY
		otherParty,
		yearMonthDate
	ORDER BY
		otherParty";
And from the first glimpse I can see that there are a lot of inconsistencies. For example this supplier delivers 4-7 pallets practically every day, however after running an SQL query I can see that the amount of CHEP pallets for each month is very differnet.
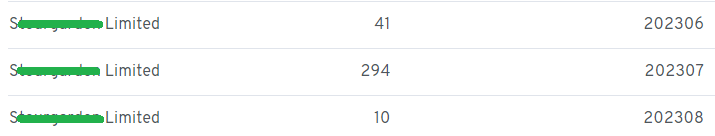
This can mean several things, but the most likely one is that on some months stock was delivered on other type of pallets, and in July they used mainly CHEP pallets. There is also a possibility, that in July they just transferred the outstanding balance from May and April on CHEP website, hence the sharp increase.
So to determine which case is it, I ran an SQL query to check how many pallets were delivered by this supplier during this period,
        SELECT
	        otherParty,
	        quantity,
                shipmentDate
        FROM ChepReport WHERE
	        otherParty = 'Suppliers Name'
        ORDER BY
                shipmentDate;
and the result is this:
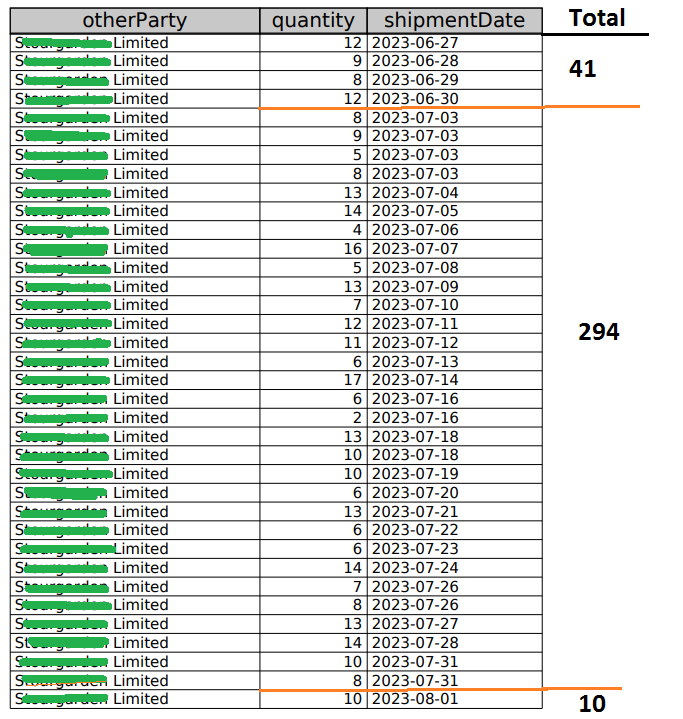
As this data is for a period of half a year, it means that for some months this supplier hasn’t used any CHEP pallets, and in some it used almost 300. This result confirms my concern that suppliers are using CHEP pallets inconsistently, and using our Delivery schedule or Protean to determine received CHEP pallets is not a option.
It also makes my idea of using month by month chart for each suppliers delivered CHEP pallets pretty useless, however I will still continue to develop this project, as it helps me learn. I’ll just add additional chart where all CHEP pallets transferred to us and all pallets returned from us are displayed in two bar charts. By idea the quantities should be close to identical, otherwise it will require to be looked at.